
Data analysis is crucial, but it is equally important to consider how people interact with, understand, and interpret data. Data Visualization is the practice of translating information into a visual context to make data easier for the human brain to understand and pull insights from.
Numerical vs Categorical Data Visualization
Numerical data may be visualized in different ways depending on the type of data being investigated. Some of the data visualization techniques adopted by numerical data include; scatter plot, dot plot, stacked dot plot, histograms, etc.
Categorical analysis takes a dimension (for example, [Regions]) and breaks it apart by a measure (for example, [Sales]). A dimension is typically a categorical value; these do not get aggregated.
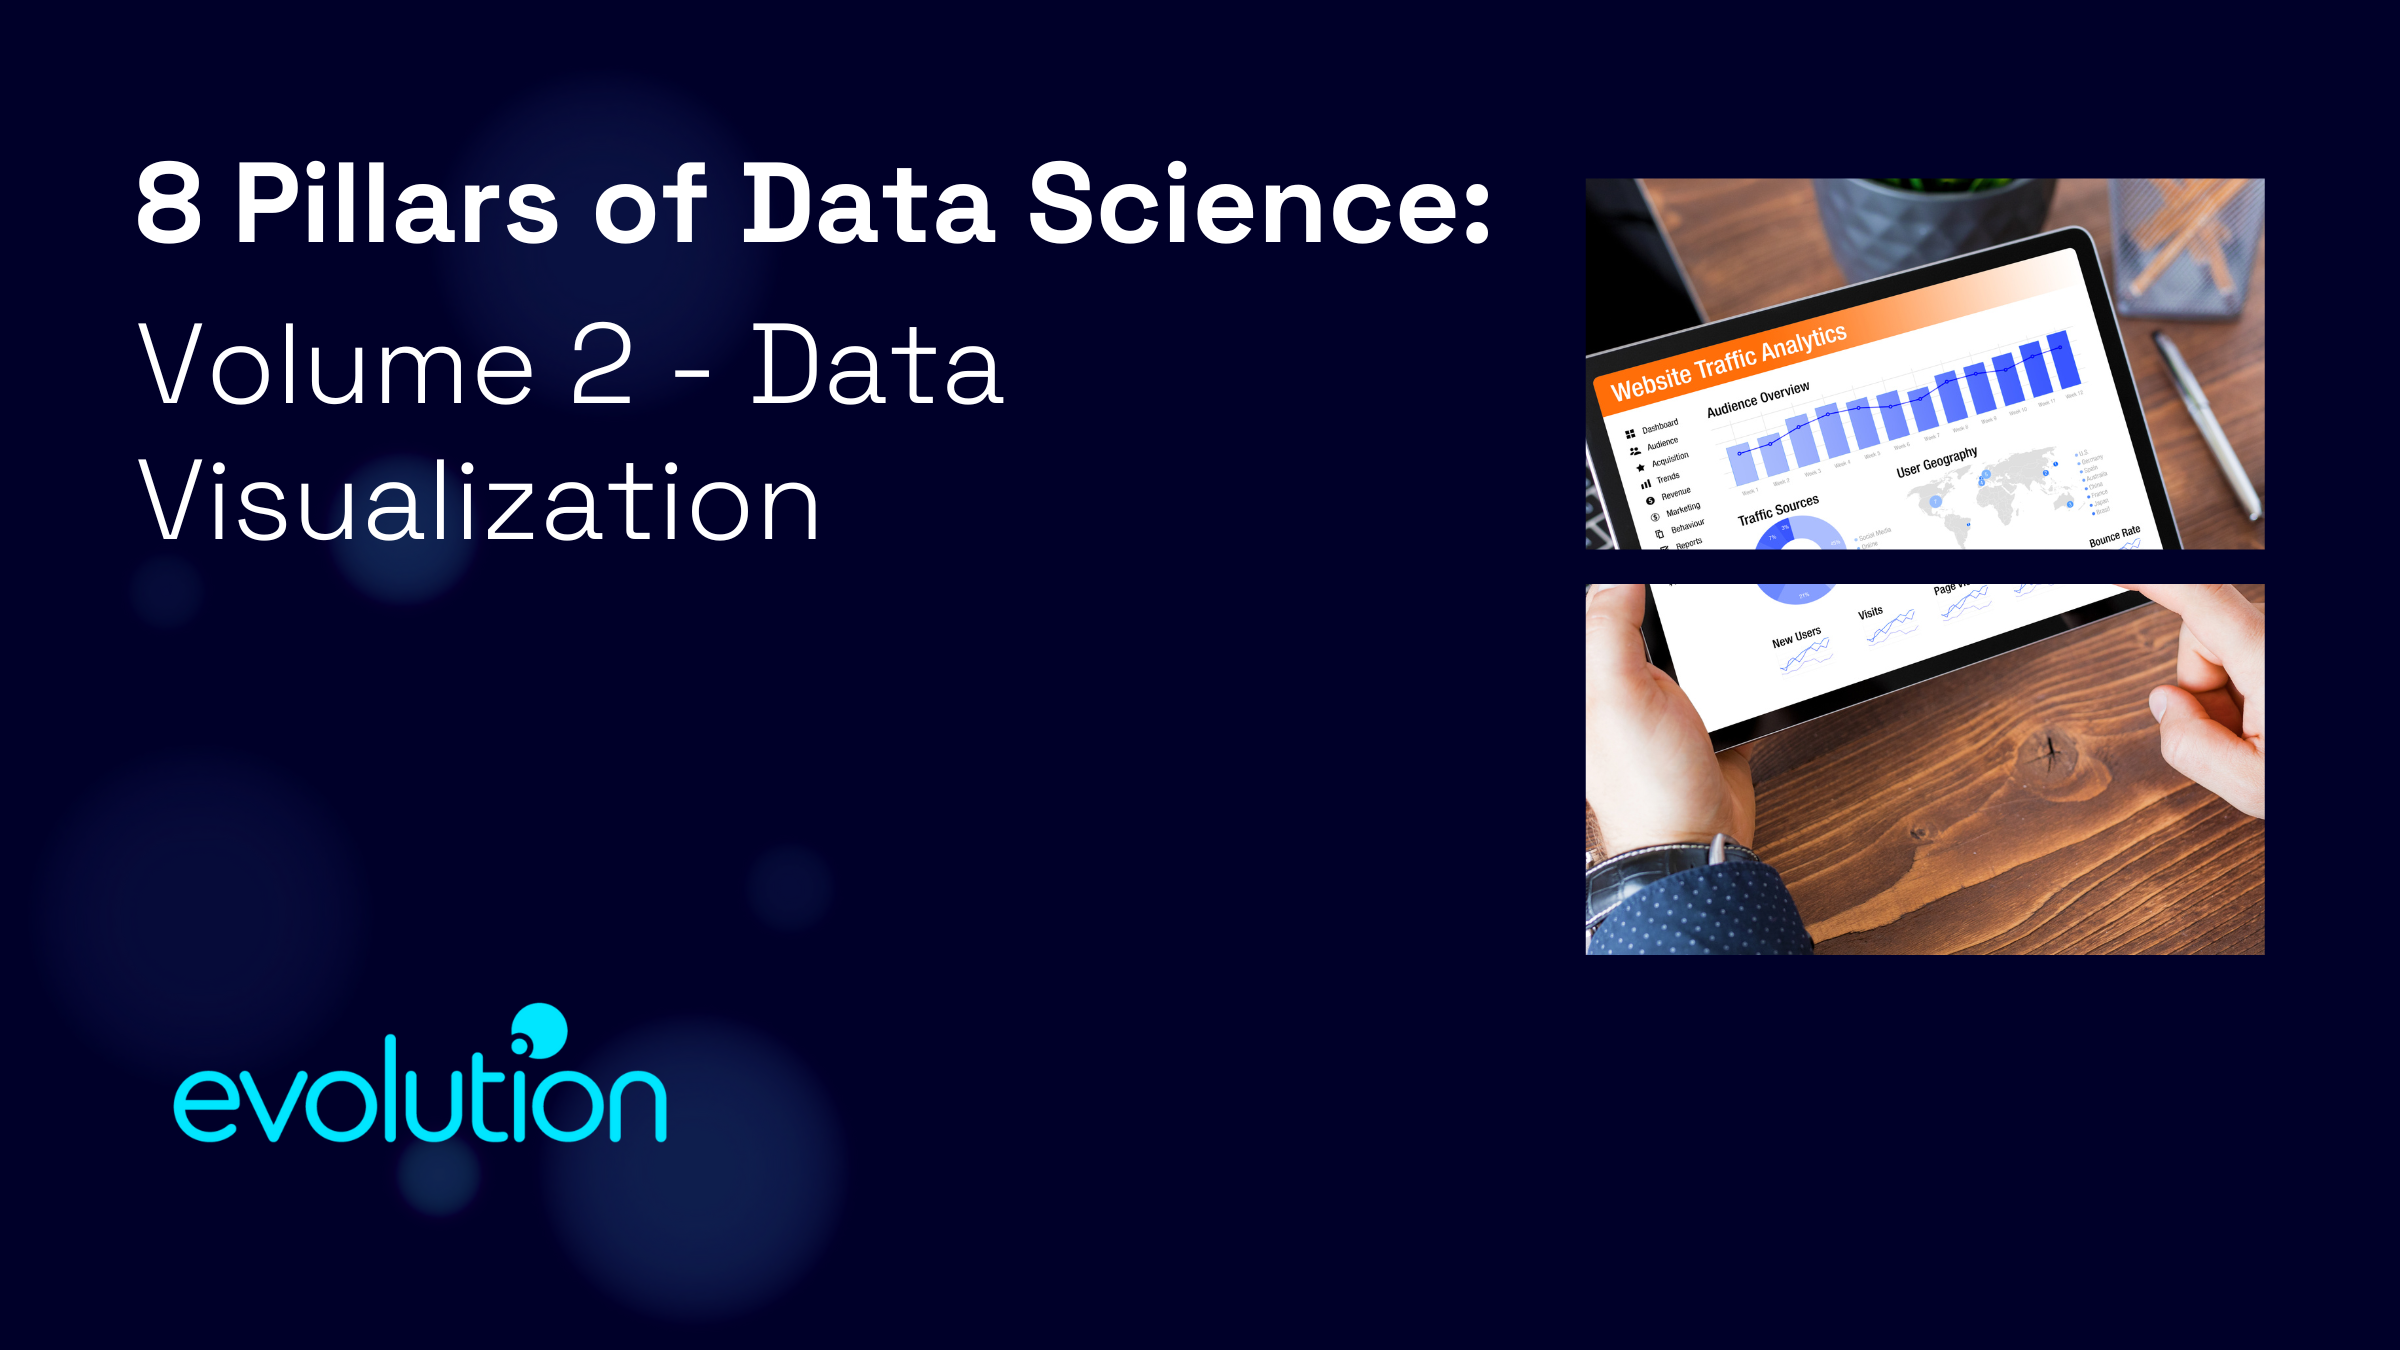
How to Visualize Data
Some of the most common ways to visualize your data is through Tableau, Power Bi and Matplotlib ggplot.
Tableau: a platform for discovering, preparing, visualizing, and sharing data. It’s highly scalable and is used by data science teams across all vertical markets. There are four main products within Tableau suite: Tableau Prep – for data prep; Tableau Desktop – for delivering insights across the enterprise; Tableau Server/Online – for hosting and sharing data. Data scientists often need to break down information and make it digestible for internal teams, C-level executives, colleagues, and customers. As such, data must be presented in a way that’s easy to view and understand—which is where Tableau shines.
Some Courses to help you upskill yourself are:
- Fundamentals of Visualization with Tableau – UC Davis
- Data Visualization and Communication with Tableau – Duke University
- How to visualize Research Data in Tableau – Coursera
- Creating an Interactive Graph with Tableau Public – Coursera
Microsoft Power BI: Power BI is a unified, scalable platform for self-service and enterprise business intelligence (BI). You can use Power BI to find insights within an organization’s data. Power BI can help connect disparate data sets, transform and clean the data into a data model and create charts or graphs to provide visuals of the data. All of this can be shared with other Power BI users within the organization
Here are some courses that can help you improve your skills:
- Data-Driven decision with Power BI – Knowledge Accelerators
- Build Dashboards in Power BI – Coursera
- Data Analytics in Power BI – Coursera
- Automated Machine Learning in Power BI Classification – Coursera
Matplotlib/ggplot (Grammar of Graphics): Matplotlib is a plotting library for Python programming language and its numerical mathematics extension NumPy. It provides an object-oriented API for embedding plots into application using general purpose GUI toolkits like Tkinter, wxPython, Qt or GTK ( https://www.activestate.com/resources/quick-reads/what-is-matplotlib-in-python-how-to-use-it-for-plotting/ ). Ggplot is an open-source data visualization package for R programming language. Although both libraries allow you to create highly customized data visualizations, ggplot generally allows you to do so in fewer lines of code compared to Matplotlib.
Useful Matplotlib/ggplot courses:
- Python for Data Visualization: Matplotlib & Seaborn (enhanced) – Coursera
- Data Analysis in Python with pandas & matplotlib in Spyder – Codio
- Data Visualization with Python – IBM Skills Network
- Using ggplot – Coursera
- Data Visualization in R with ggplot2 – Johns Hopkins University
- Exploratory Data Analysis for the Public Sector with ggplot – University of Michigan
Summary
Whether you’re a beginner or an experienced data scientist, continuously learning and exploring new data visualization techniques can help in delivering insights and making data-driven decisions. If you are interested in learning more about data science, or exploring career opportunities in the field, feel free to get in touch with us. We would be more than happy to provide guidance and support as you navigate this exciting field.
Data Science Podcast
Are you a tech leader with a passion for data science? Join our podcast and share your insights with our audience. Simply click the “Contact Us” button and fill out the form to express your interest.